Data visualization is usually seen as a tool for scientists, statisticians, and business analysts to reveal patterns, trends, and insights in vast datasets. But beyond these traditional domains, creative minds have been finding unusual and innovative ways to present data, showcasing its potential in the realms of art, music, sports, and more. This article journeys through some of these unexpected data visualization uses, reminding us that data is not just about numbers but also stories, experiences, and emotions. After all, we are human, and data helps us better understand our lives and our world.
Our first stop is a playground. Well, more like a Play-Doh ground. Amy Cesal, a data visualization professional, decided to take data off the screen and into the physical world using Play-Doh. She molds vibrant, three-dimensional data visualizations, literally crafting stories out of data.
Then, we head to Germany, where a woman tracked delays in her 2018 commute by knitting them into a scarf. Each color represented a different delay duration, transforming her daily frustration into a tangible—and wearable—data story. See a Tweet about this here.
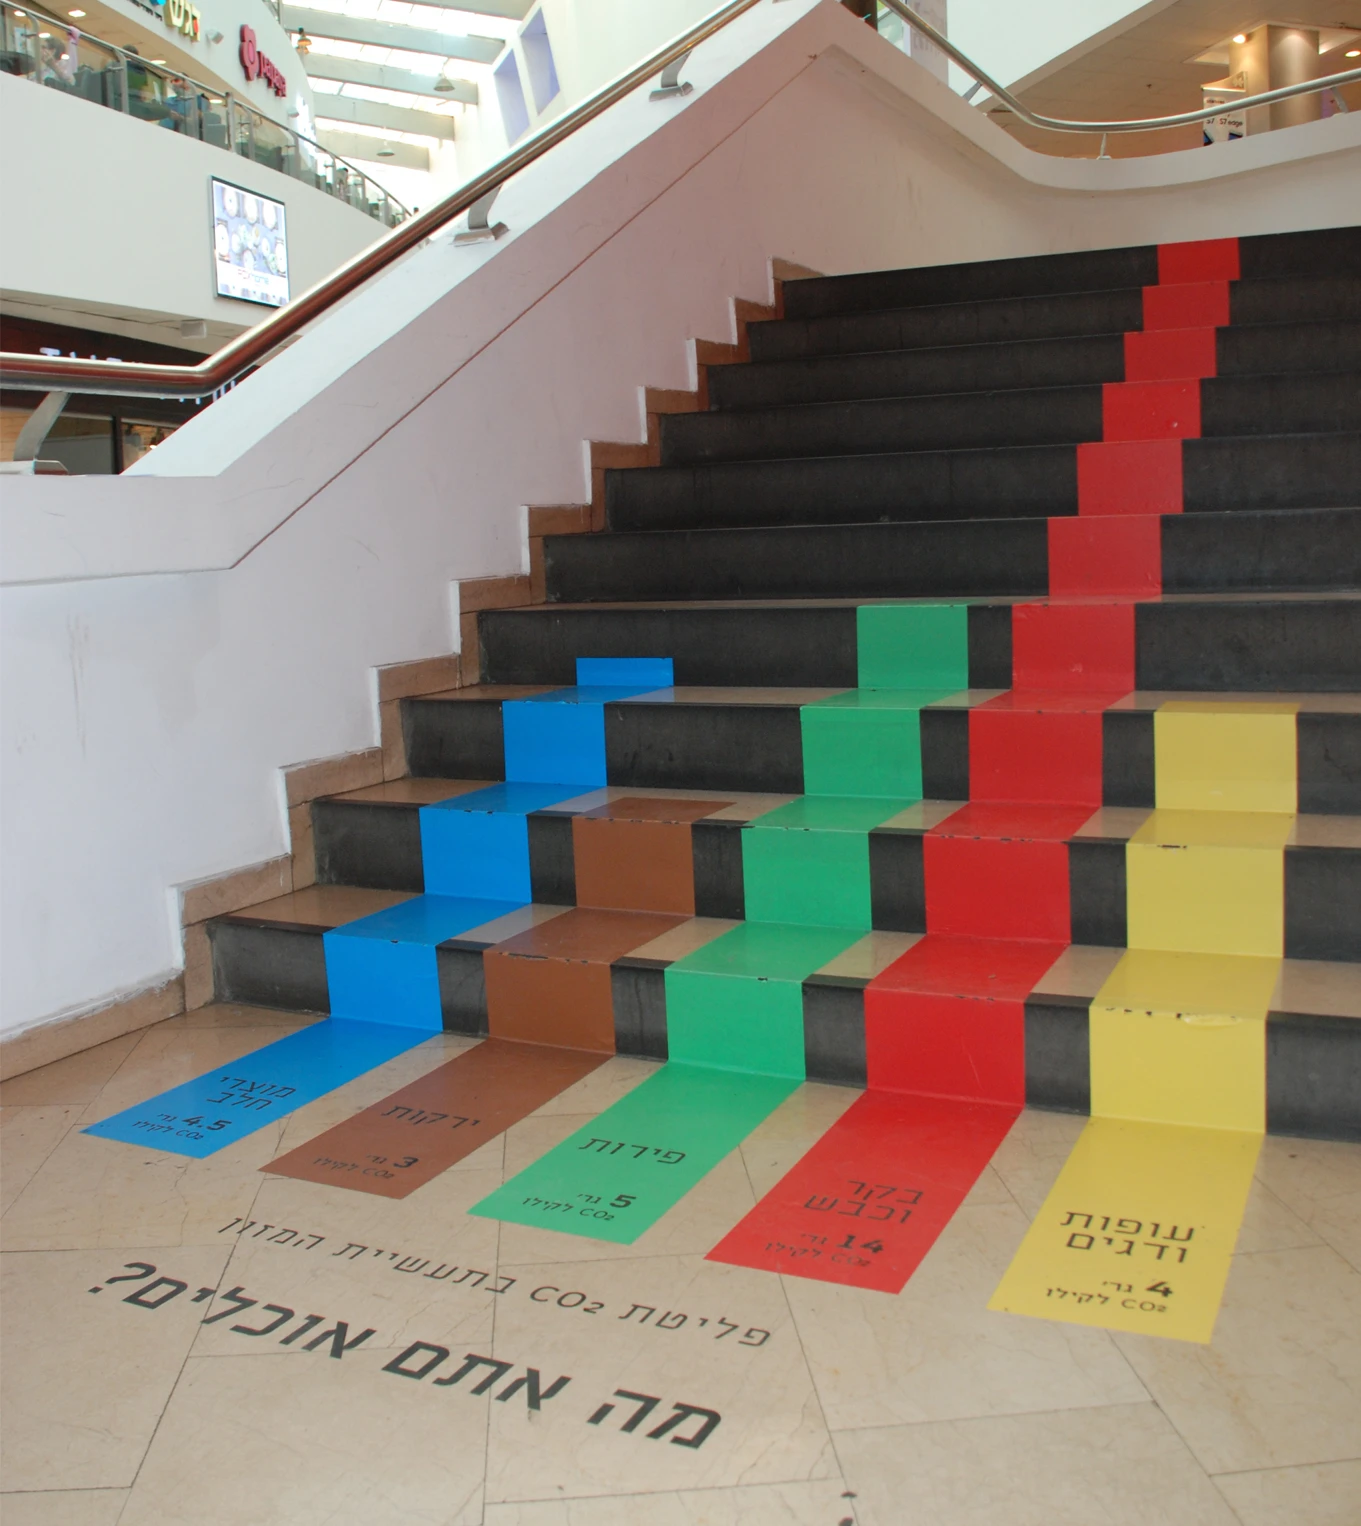
Visual artist Roni Levit takes data visualization to the streets, painting graphs and charts on public stairs and benches. She uses this unusual medium to publicize data about urban development near Tel Aviv, effectively turning public spaces into data exhibits.
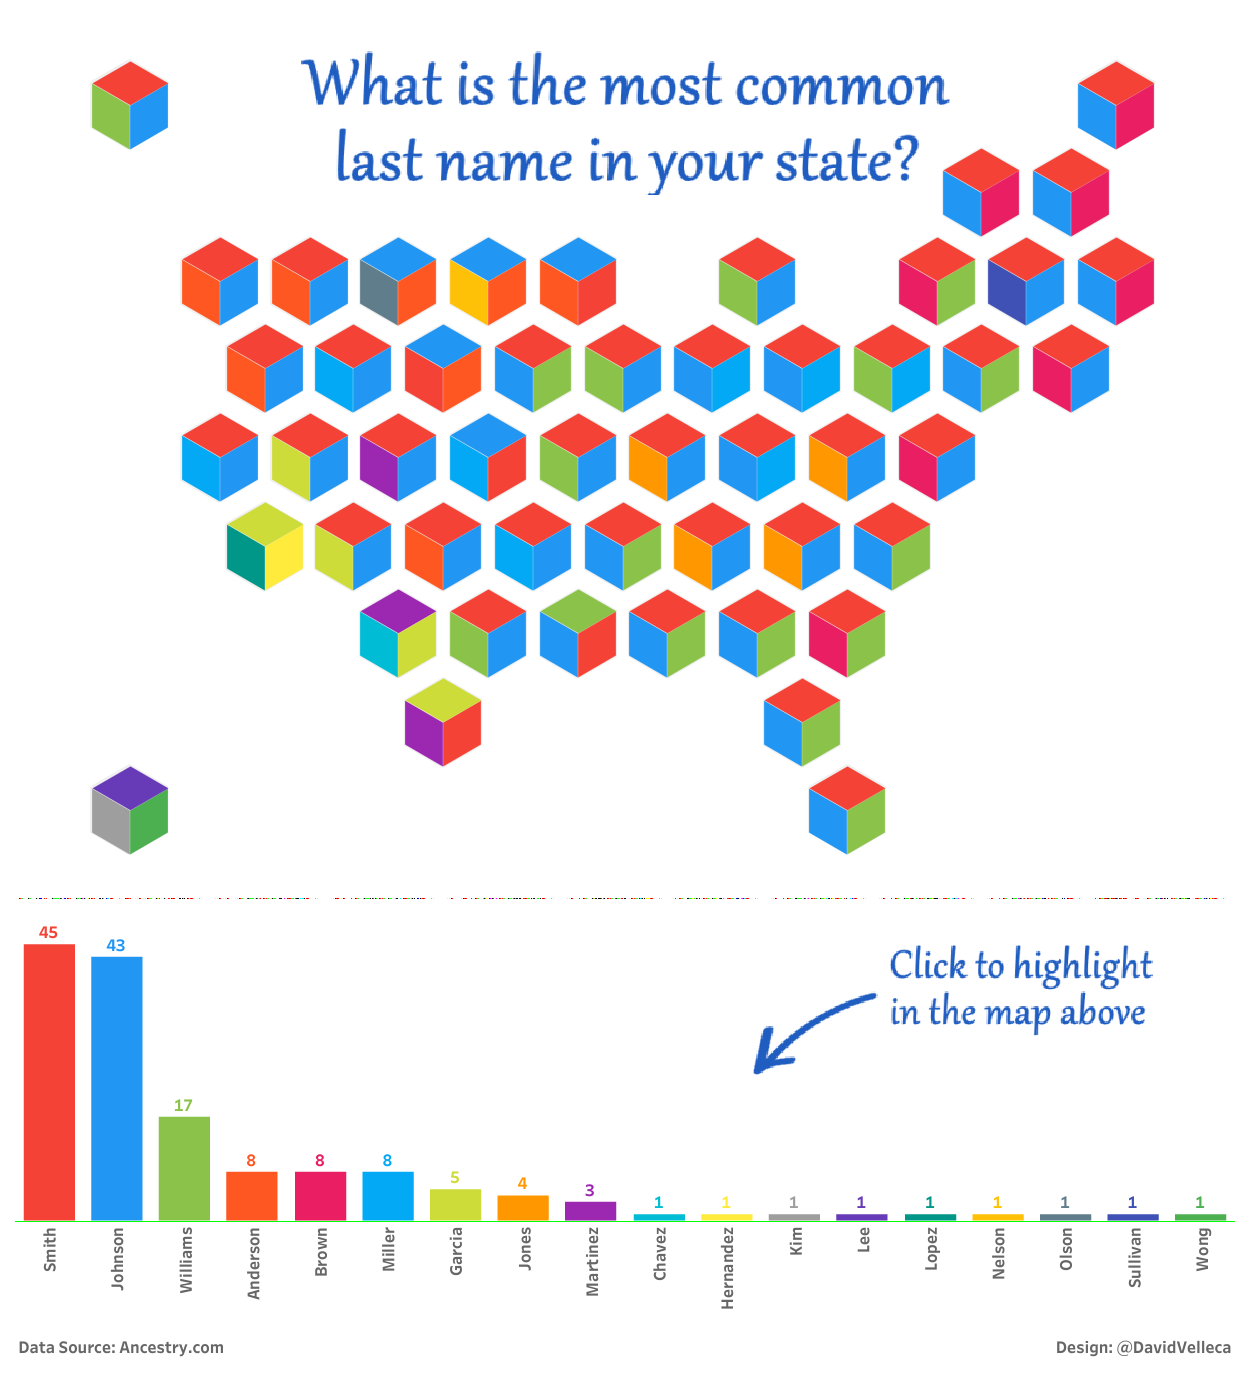
Moving from the streets to the digital world, David Velleca created an interactive polygon map. But this is no ordinary map. Each region is represented by a three-dimensional shape, and each side of the shape represents a value. For example, in one of his works, he visualized the most common last names per state, using the first three as the values shown on each side of the shapes.
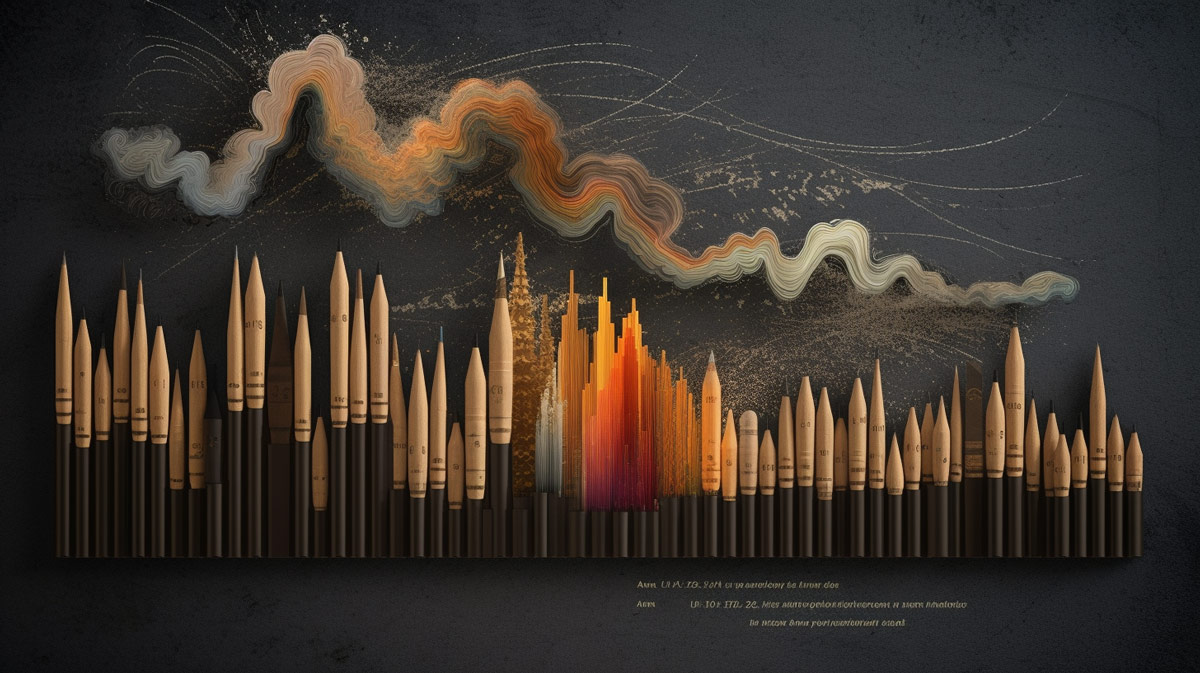
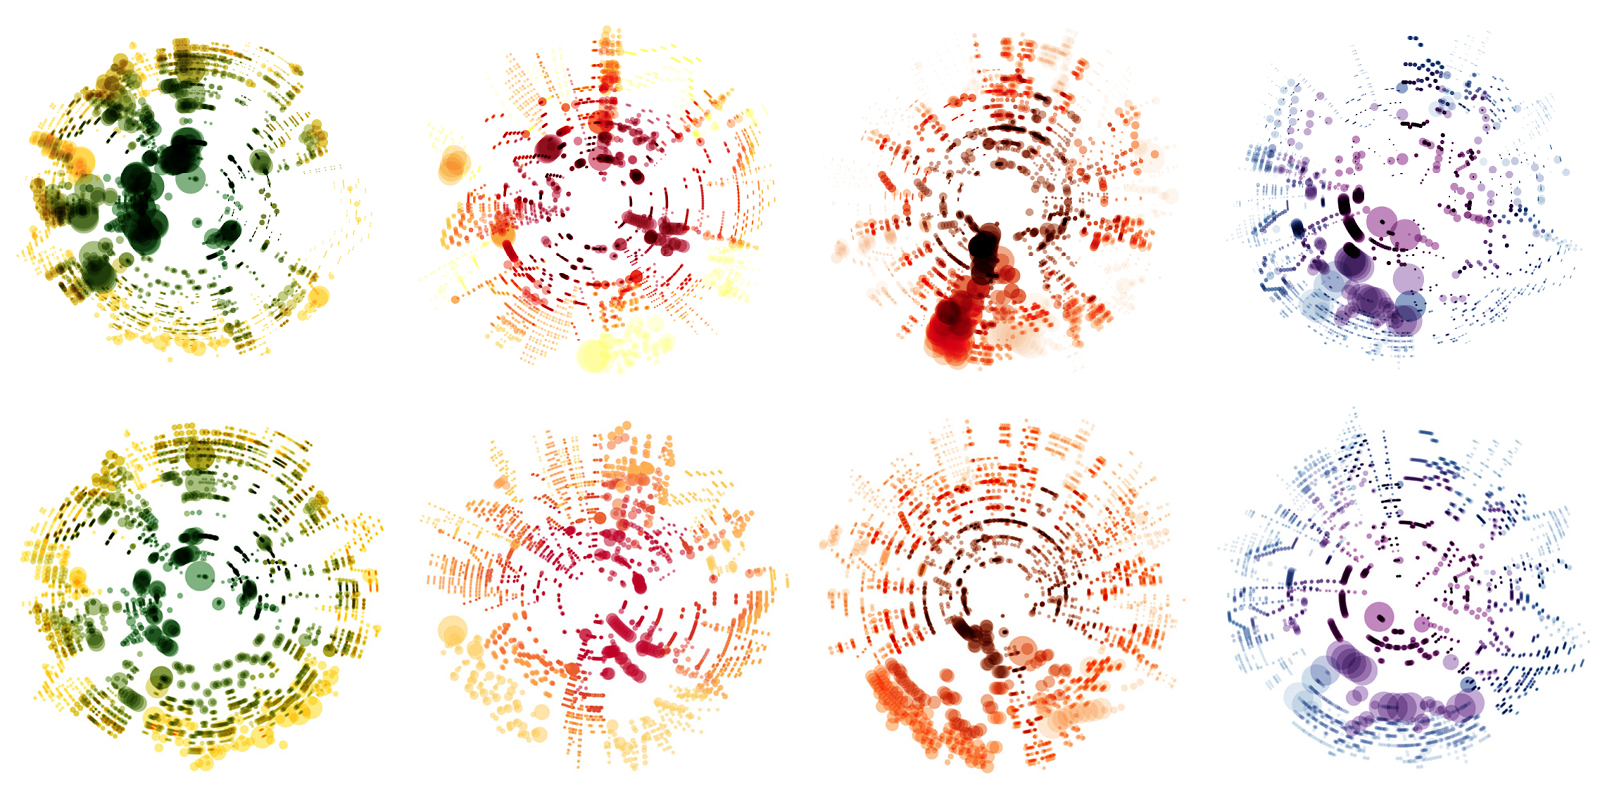
Data visualization takes a musical turn with Nicholas Rougeux, a designer and "data geek" who translates famous classical music scores into colorful imagery. Each instrument is represented by a different color, and the visualizations reveal fascinating patterns in the music. Rougeux's work is a brilliant demonstration of how data can be seen, heard, and felt in different ways.
In sports, we see innovative uses of data visualization as well. Imagine a real-time map showing wind conditions across the United States. This wind map has become a vital tool in sports like sailing and golf, where wind conditions can significantly affect the outcome. The visualization presents data in such a way that it can be immediately understood and acted upon.
Another intriguing example is in football, where teams use advanced sound visualization techniques to analyze the noise of the crowd during games. This auditory data can greatly influence a game's dynamics and strategies.
From Play-Doh to scarves, public art to music, and sports to interactive maps, these examples highlight the diverse and creative ways that data visualization is being used. They show us that data is not just about numbers on a screen but a tool for storytelling, art, and even sport. They remind us that with creativity, data can be harnessed to express more than just facts and figures—it can capture emotions, experiences, and stories, making the invisible visible and the intangible tangible. And after all, who doesn’t like a good story with words and pictures?
That's the power of data visualization. And that's the power of tools like Tractorscope, which empower users to create their own data stories, making the process not just easy but also enjoyable. By providing a platform that simplifies data visualization, Tractorscope aims to unlock this power for everyone, enabling them to see their data in new and exciting ways.
So, whether you're a data scientist, a business analyst, an artist, or just someone curious about the stories that your data can tell; remember this: data visualization is not just a tool—it's a canvas. It's a way to explore, to express, and to engage. And the possibilities are as vast as the data we have yet to discover.
So, the next time you look at a graph or a chart, think about the story it tells. Think about how it could be told differently. Think about how you could use data to tell your own stories. And remember, with tools like Tractorscope, you don't need to be a data scientist to create meaningful and impactful data visualizations. If you are in an organization with a design team, talk to them about how to augment charts with additional images or alternative layouts to better convey the points you want your data to highlight.
Data visualization is a journey, and every data point is a stop along the way. So, embark on your own data adventure. Explore the unusual, the innovative, the creative ways that people are using and displaying data. And along the way, discover the stories that data can tell.
Because, in the end, data is not just about numbers. It's about stories. It's about people. It's about us. And the more we understand it, the more we understand ourselves and the world around us.
Who knows, maybe the next unusual data visualization will be yours. Let Tractorscope be your guide. Connect to a database, model your queries, perhaps the end result could be fed into a 3D printer or projected over a sculpture... Start your data journey today.