Account home
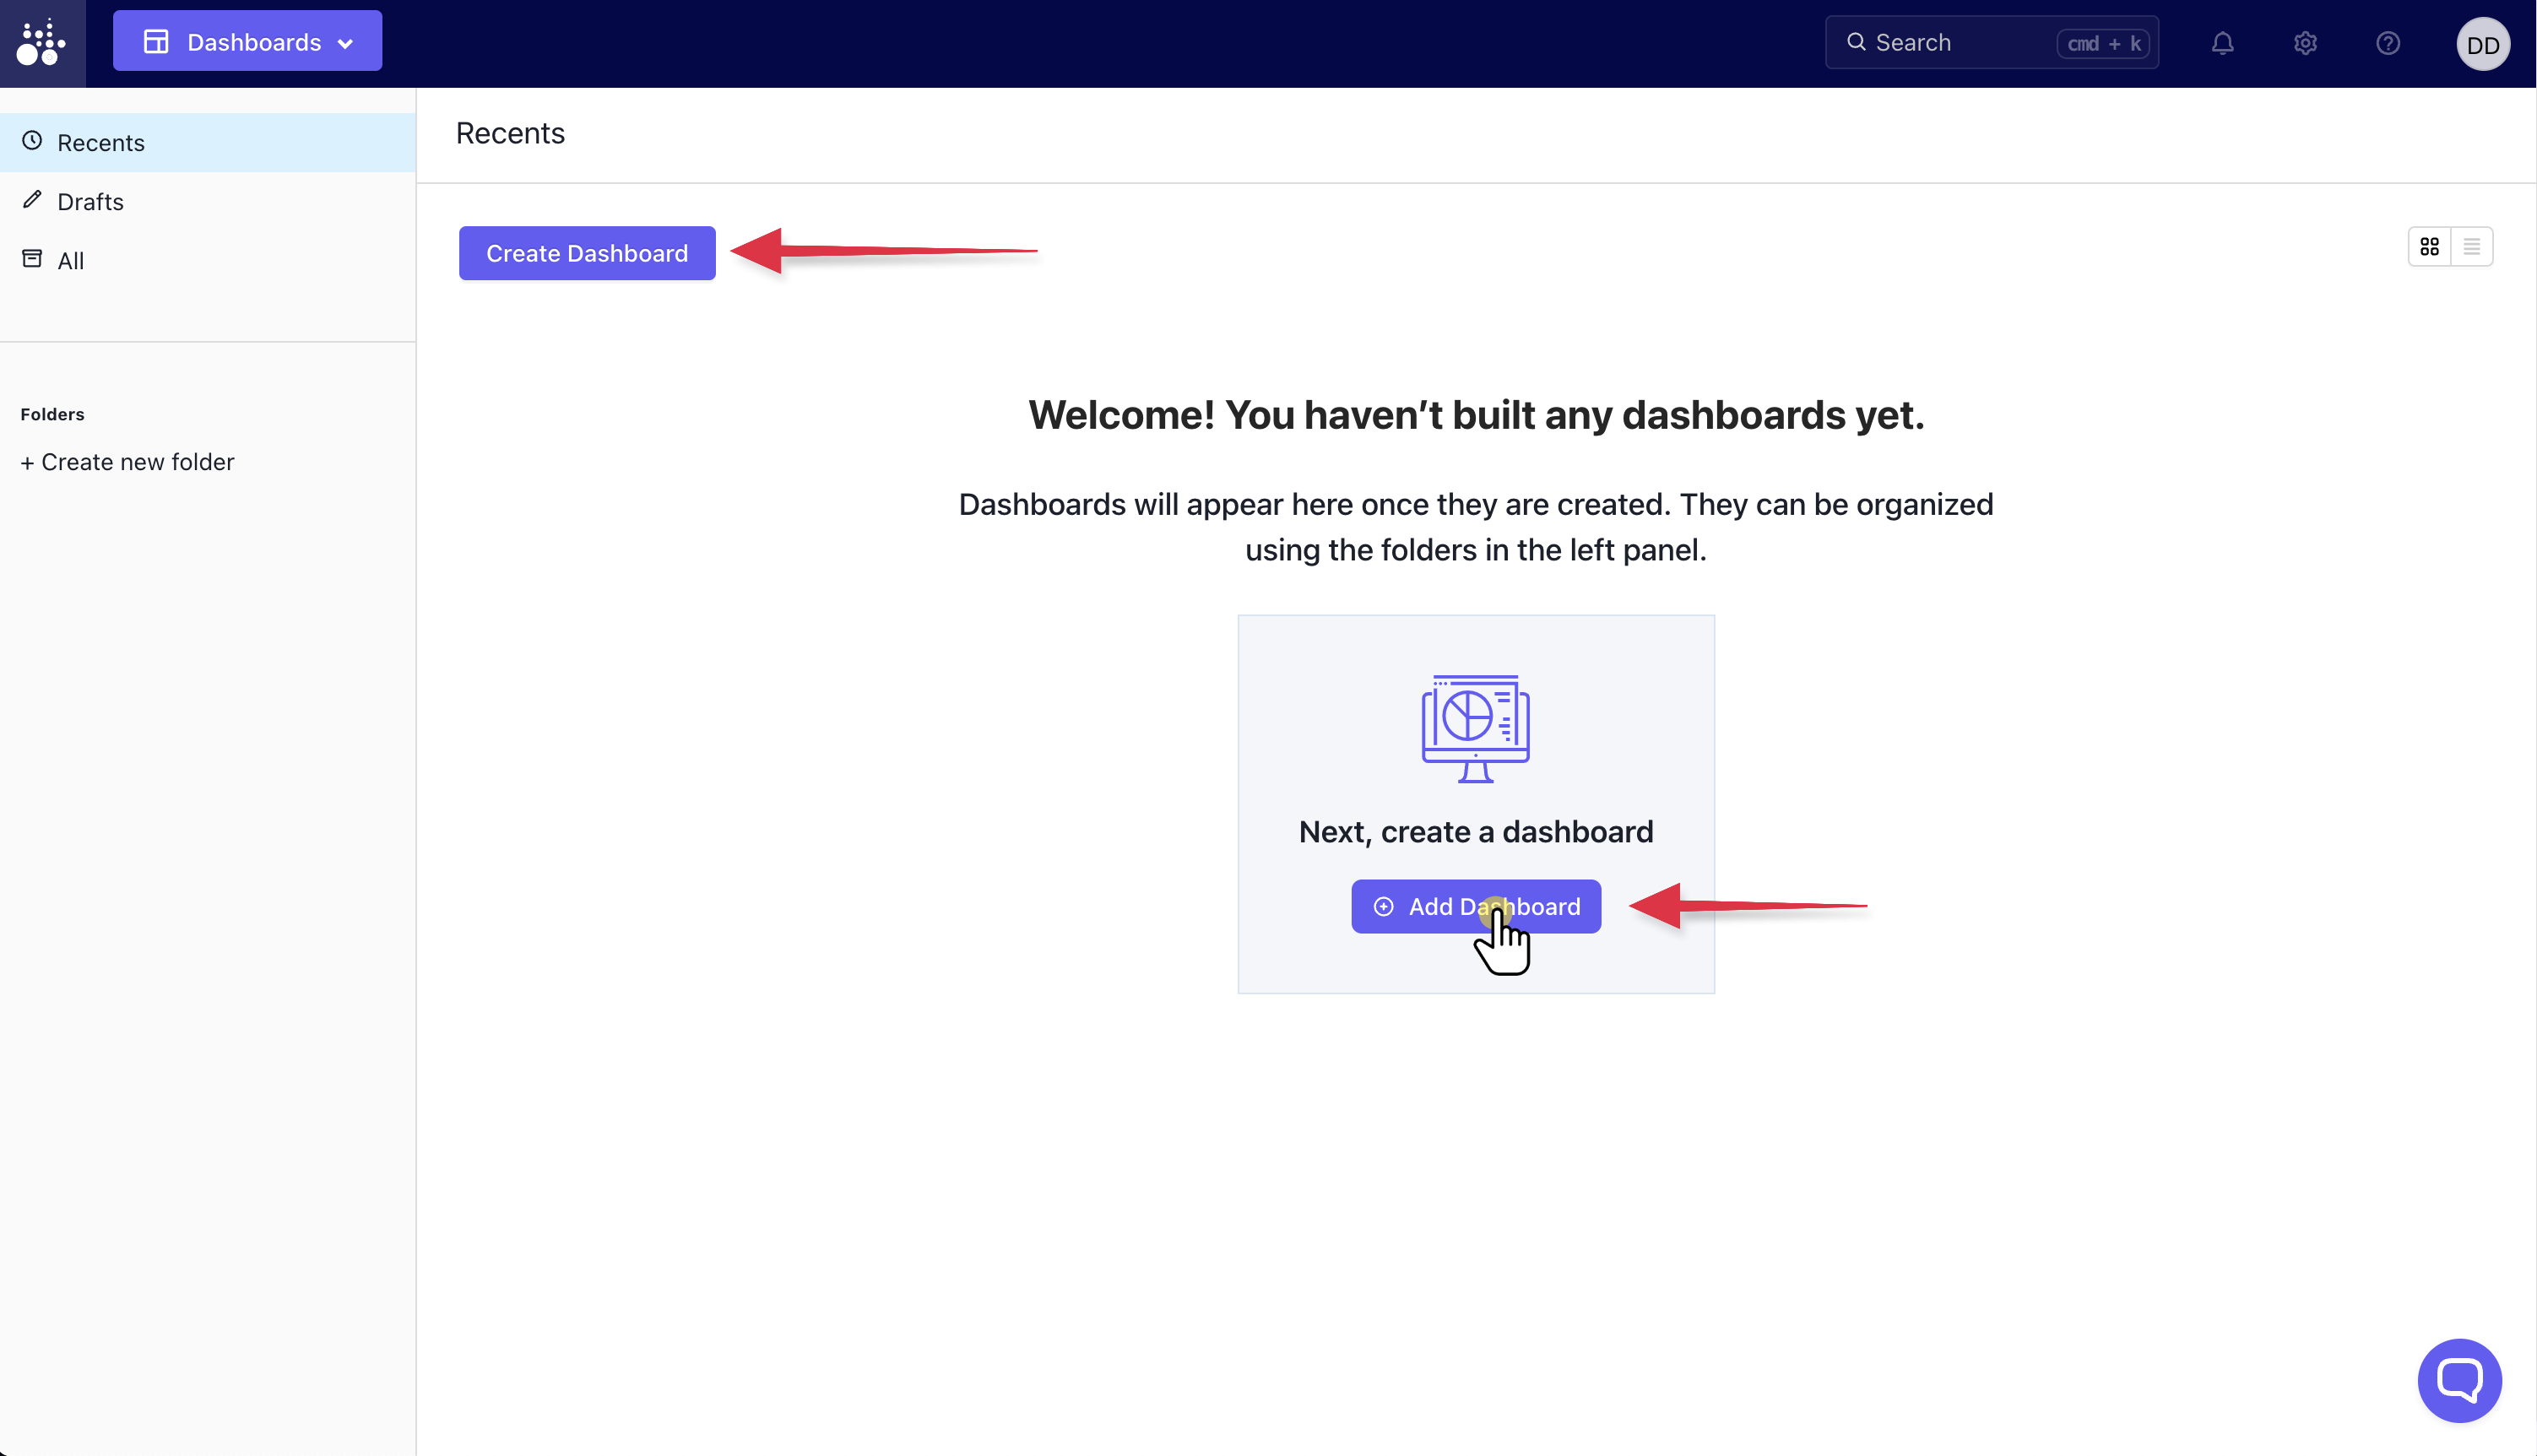
The image below is the empty state for new accounts with no charts or dashboards. Use either of the Create Dashboard buttons to start building a new dashboard.
Name dashboard
Click on the dashboard name to edit it. Once you've named your dashboard with something descriptive for your other team members, Add Chart.

Rename chart
Edit the chart name simply by clicking on it and typing.

Run your first query
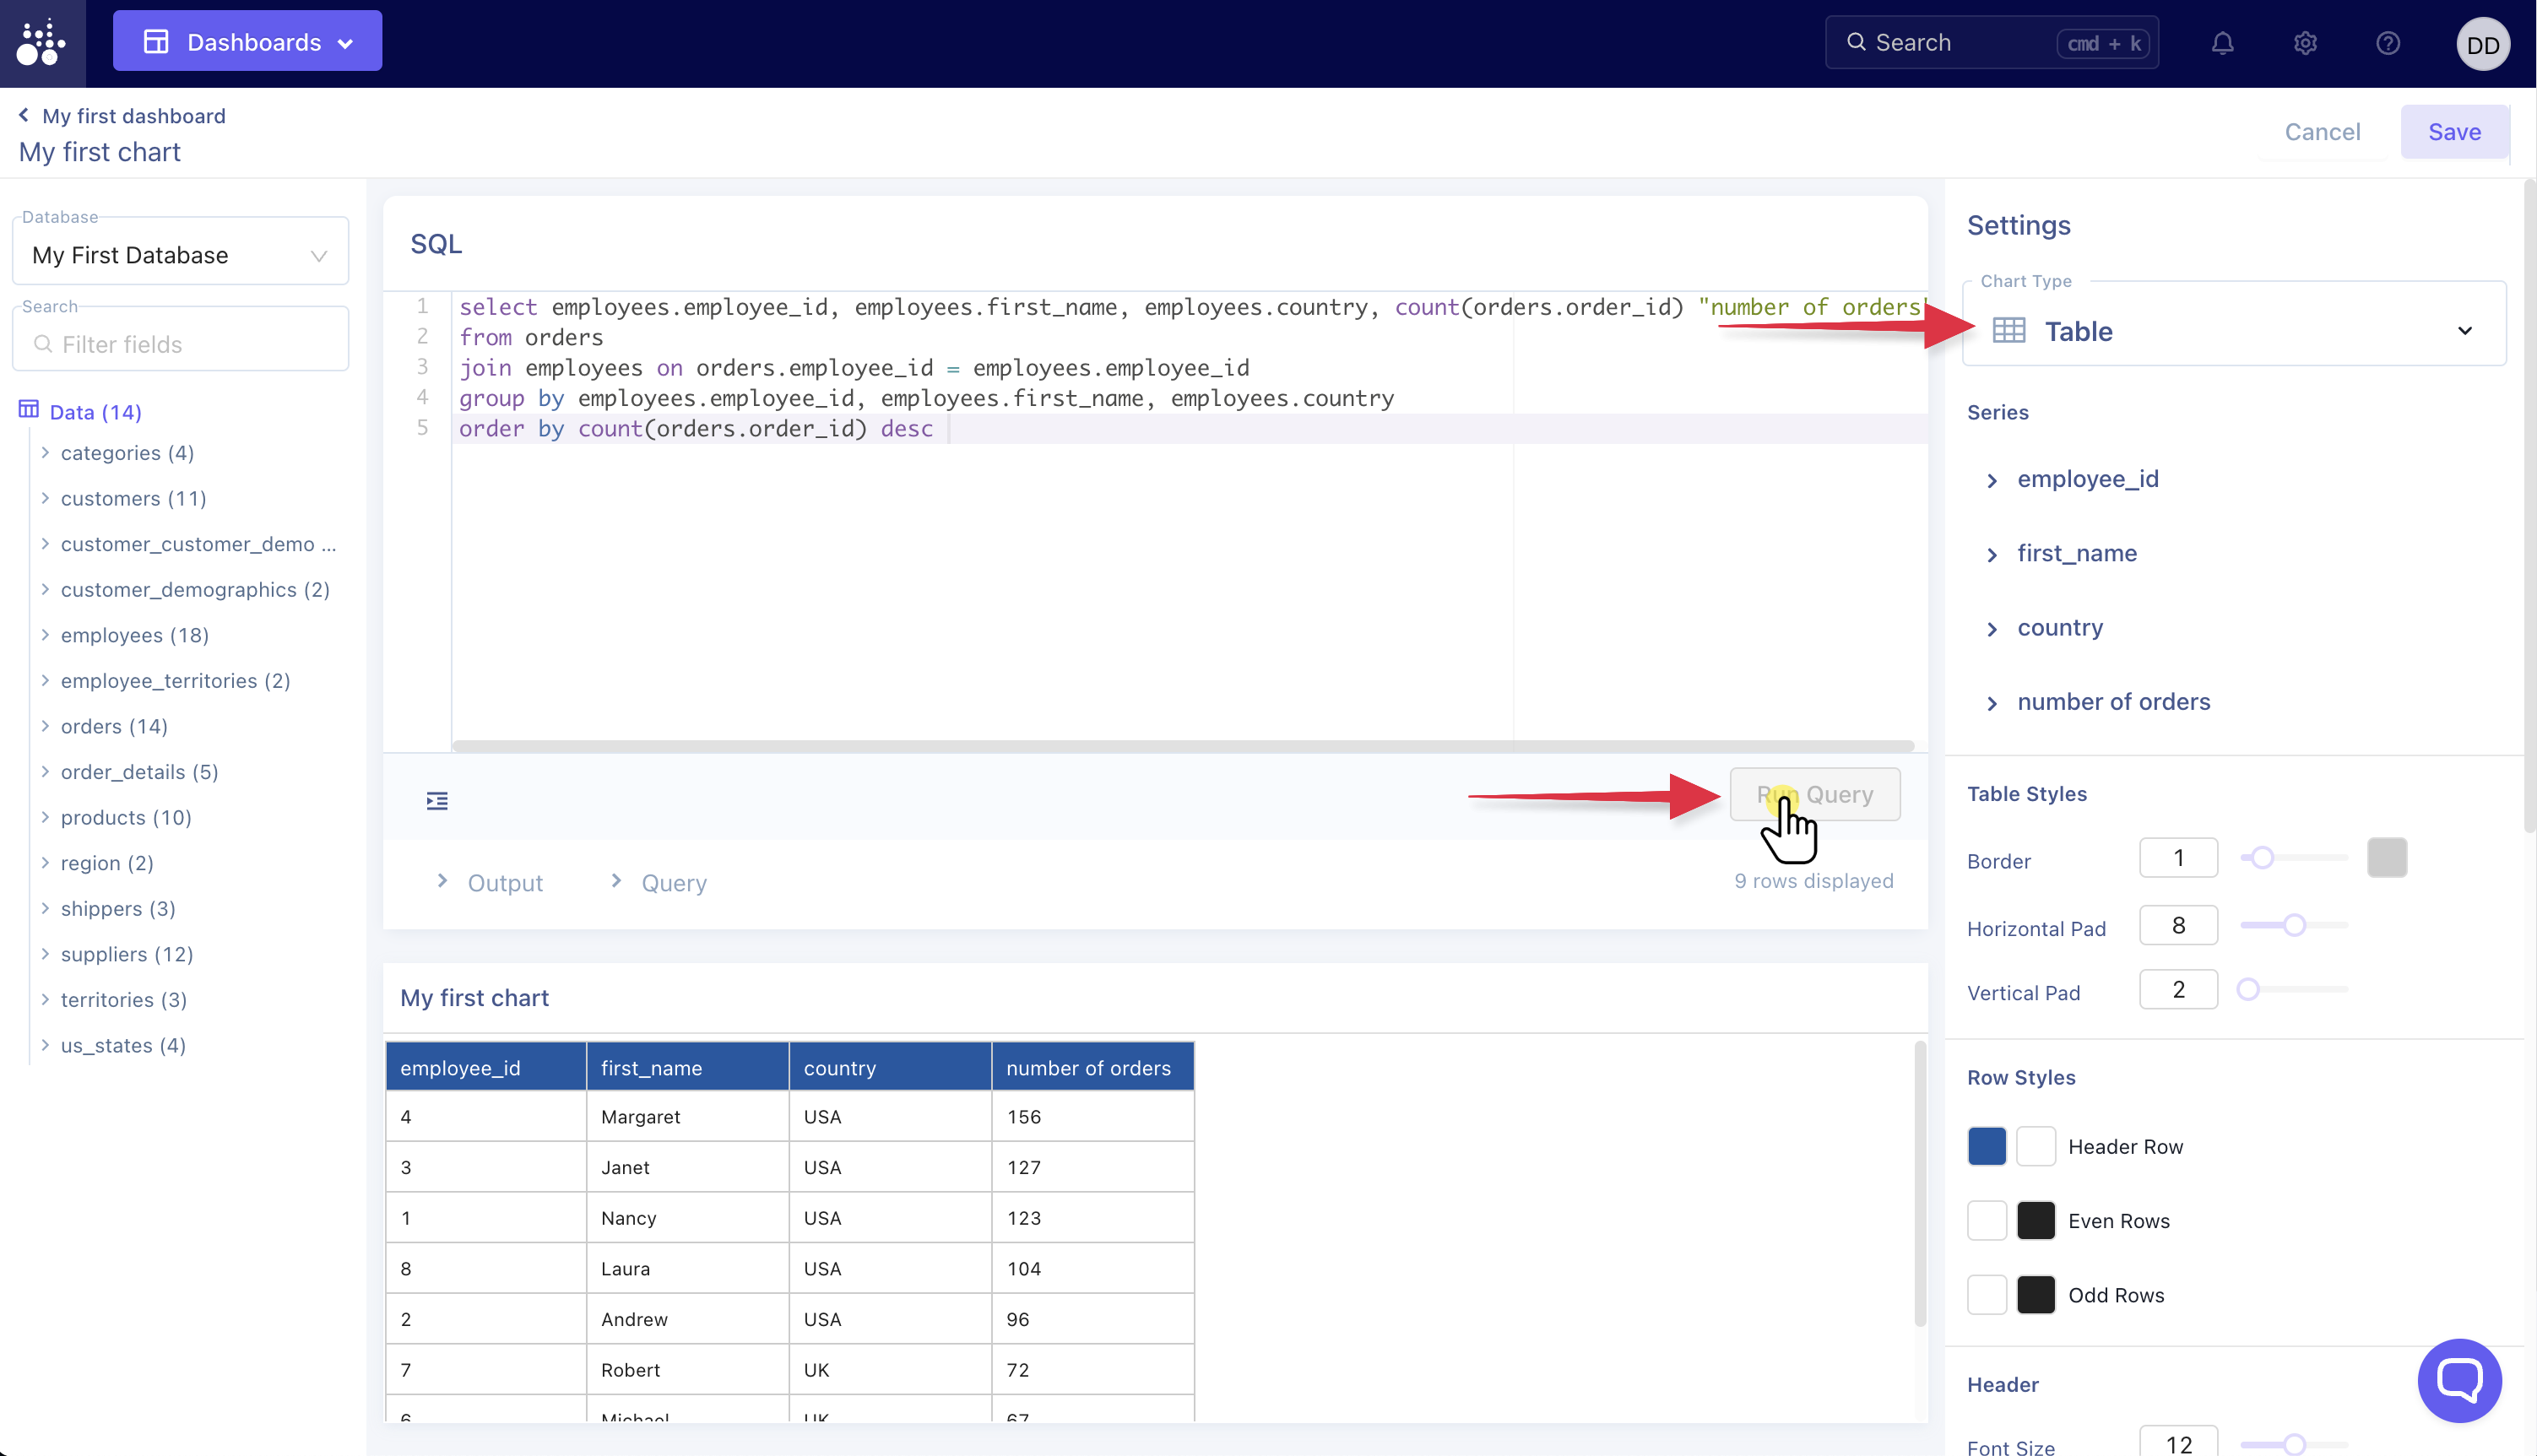
Enter SQL into the editor field, run the query. The default chart type is Table, change this as needed to suit the visualization you want to create.
Adjust settings
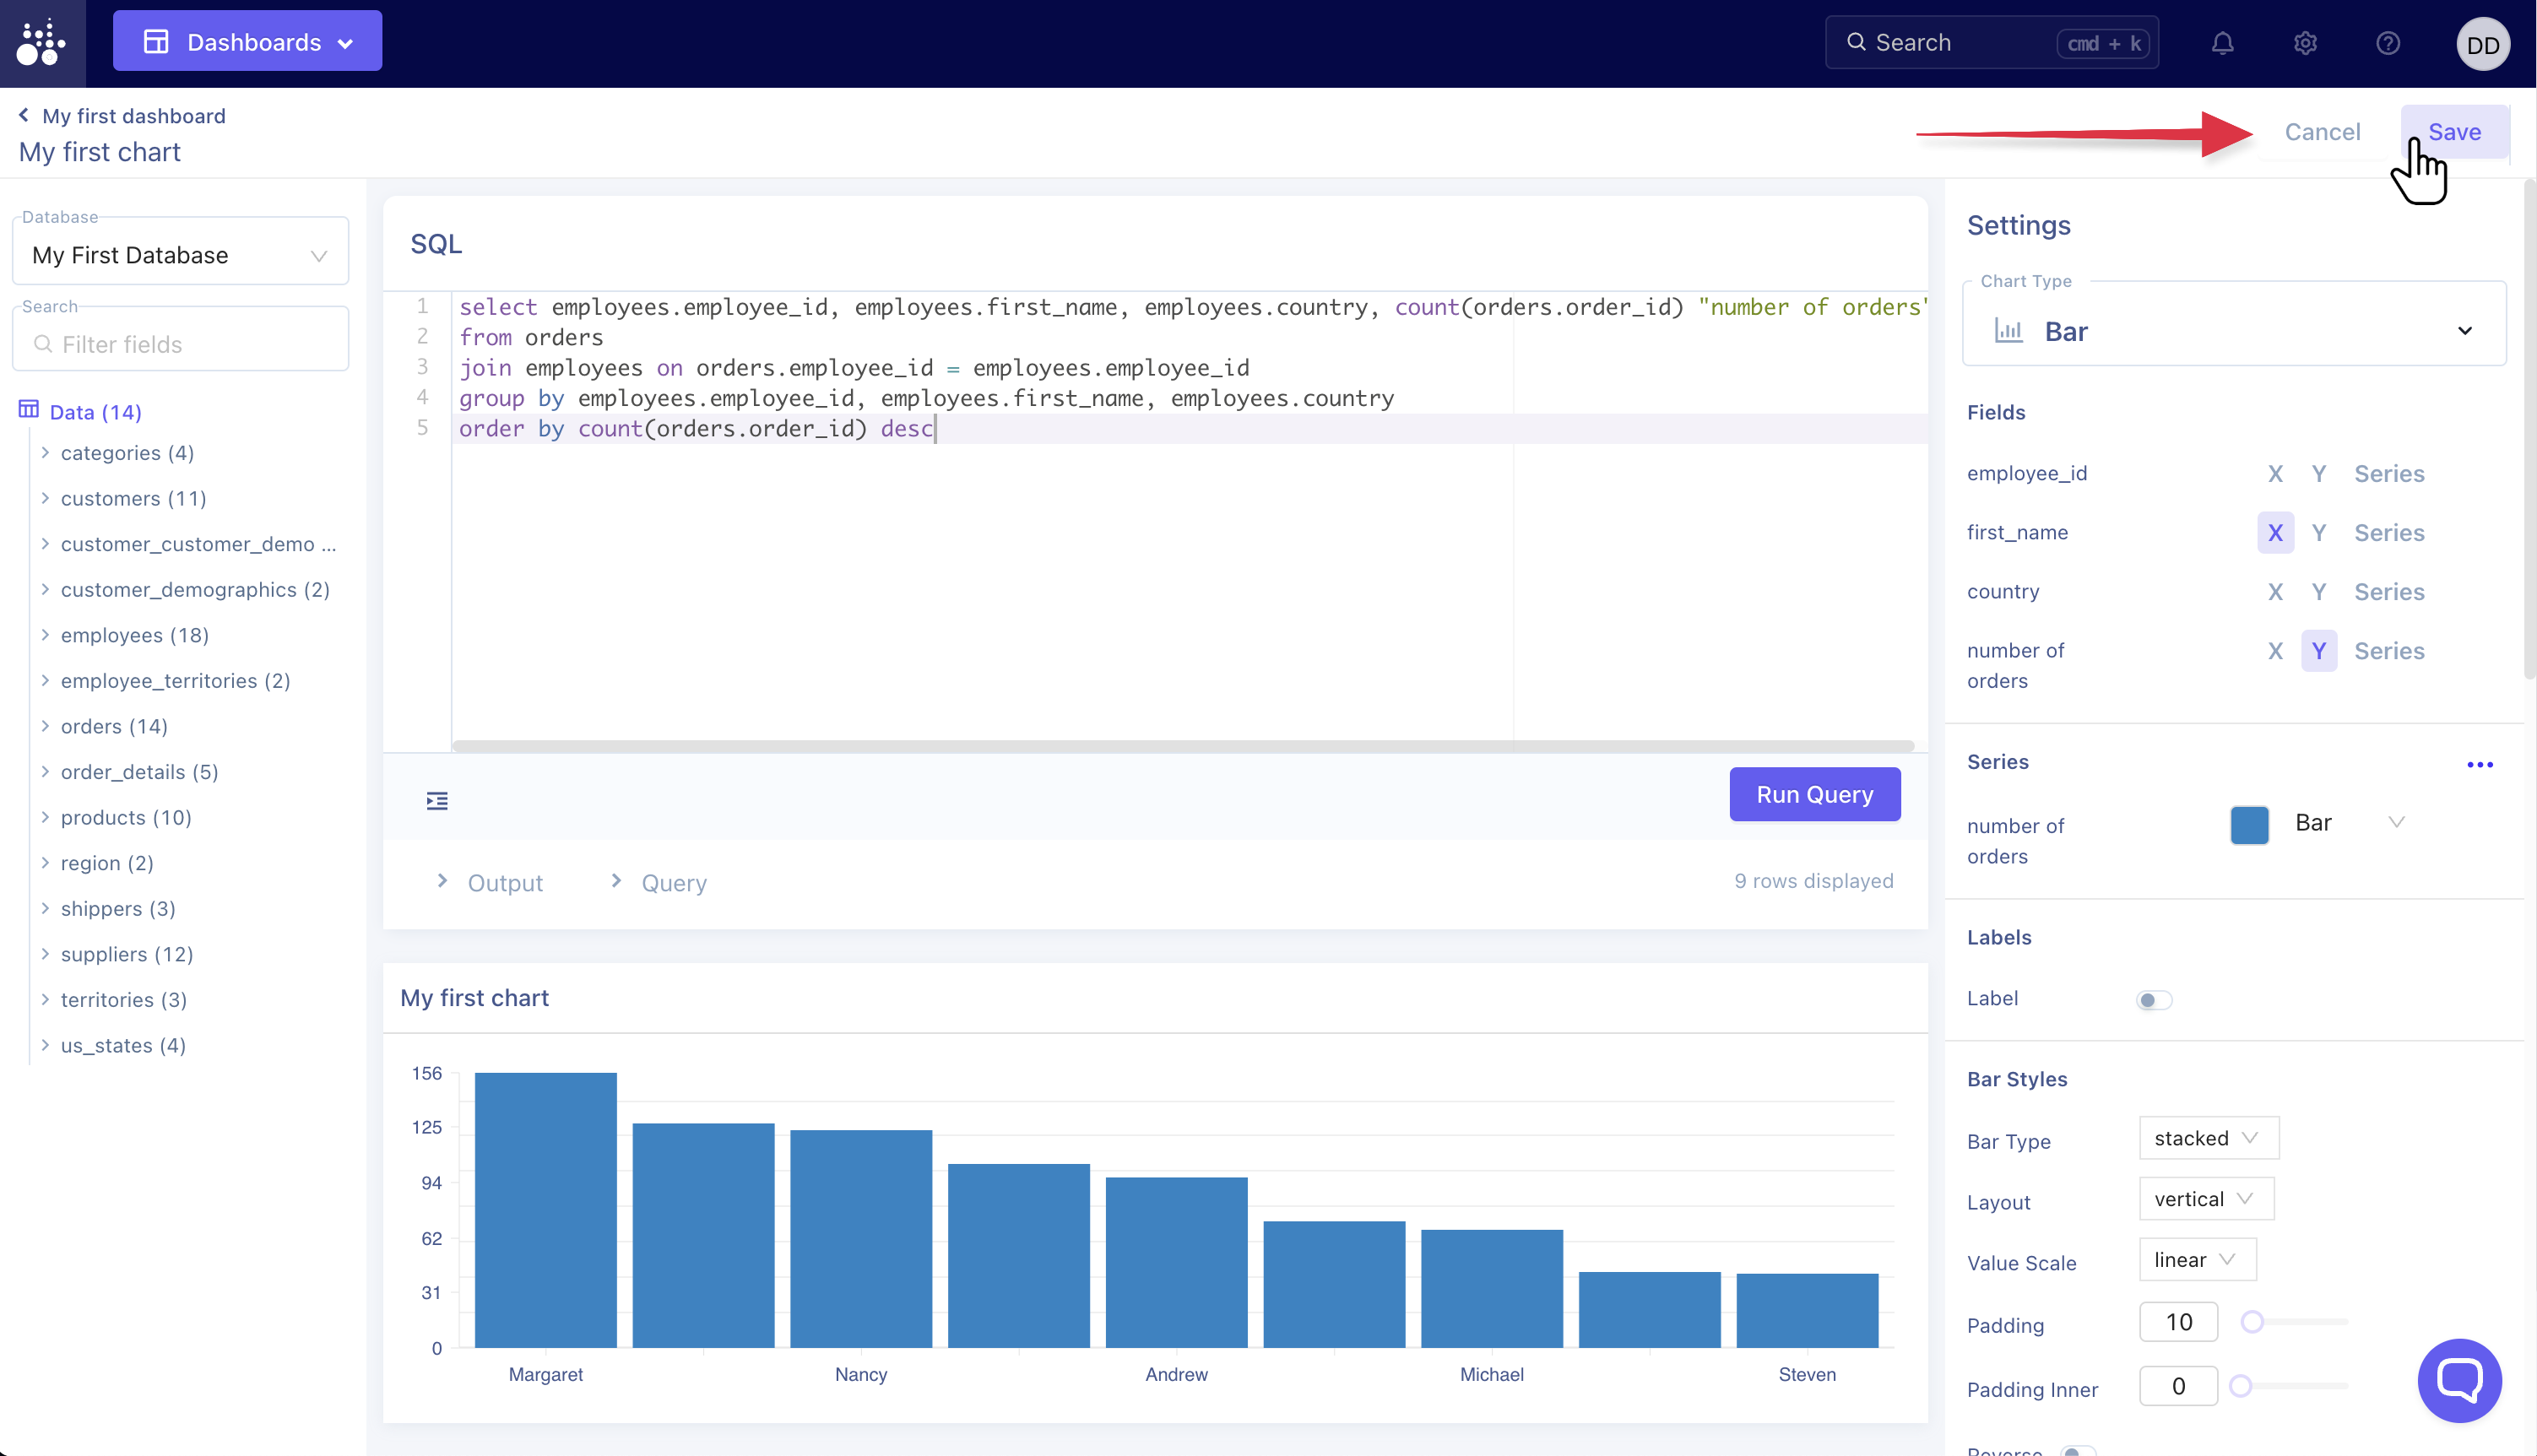
The Settings panel on the right side of the page has all the controls to adjust the chart. We'll go into those in detail in a different tutorial. Be sure to Save any changes you want to keep.
Return to dashboard
Go back to the main dashboard view to see the chart.

Edit dashboard
The top right of the dashboard is broken into three functional sections:
- Refresh dashboard
- Add chart, text or image
- Dashboard design, sharing and embedding, and archive
In addition you can click and drag any element on the dashboard to manually move them around, or resize.

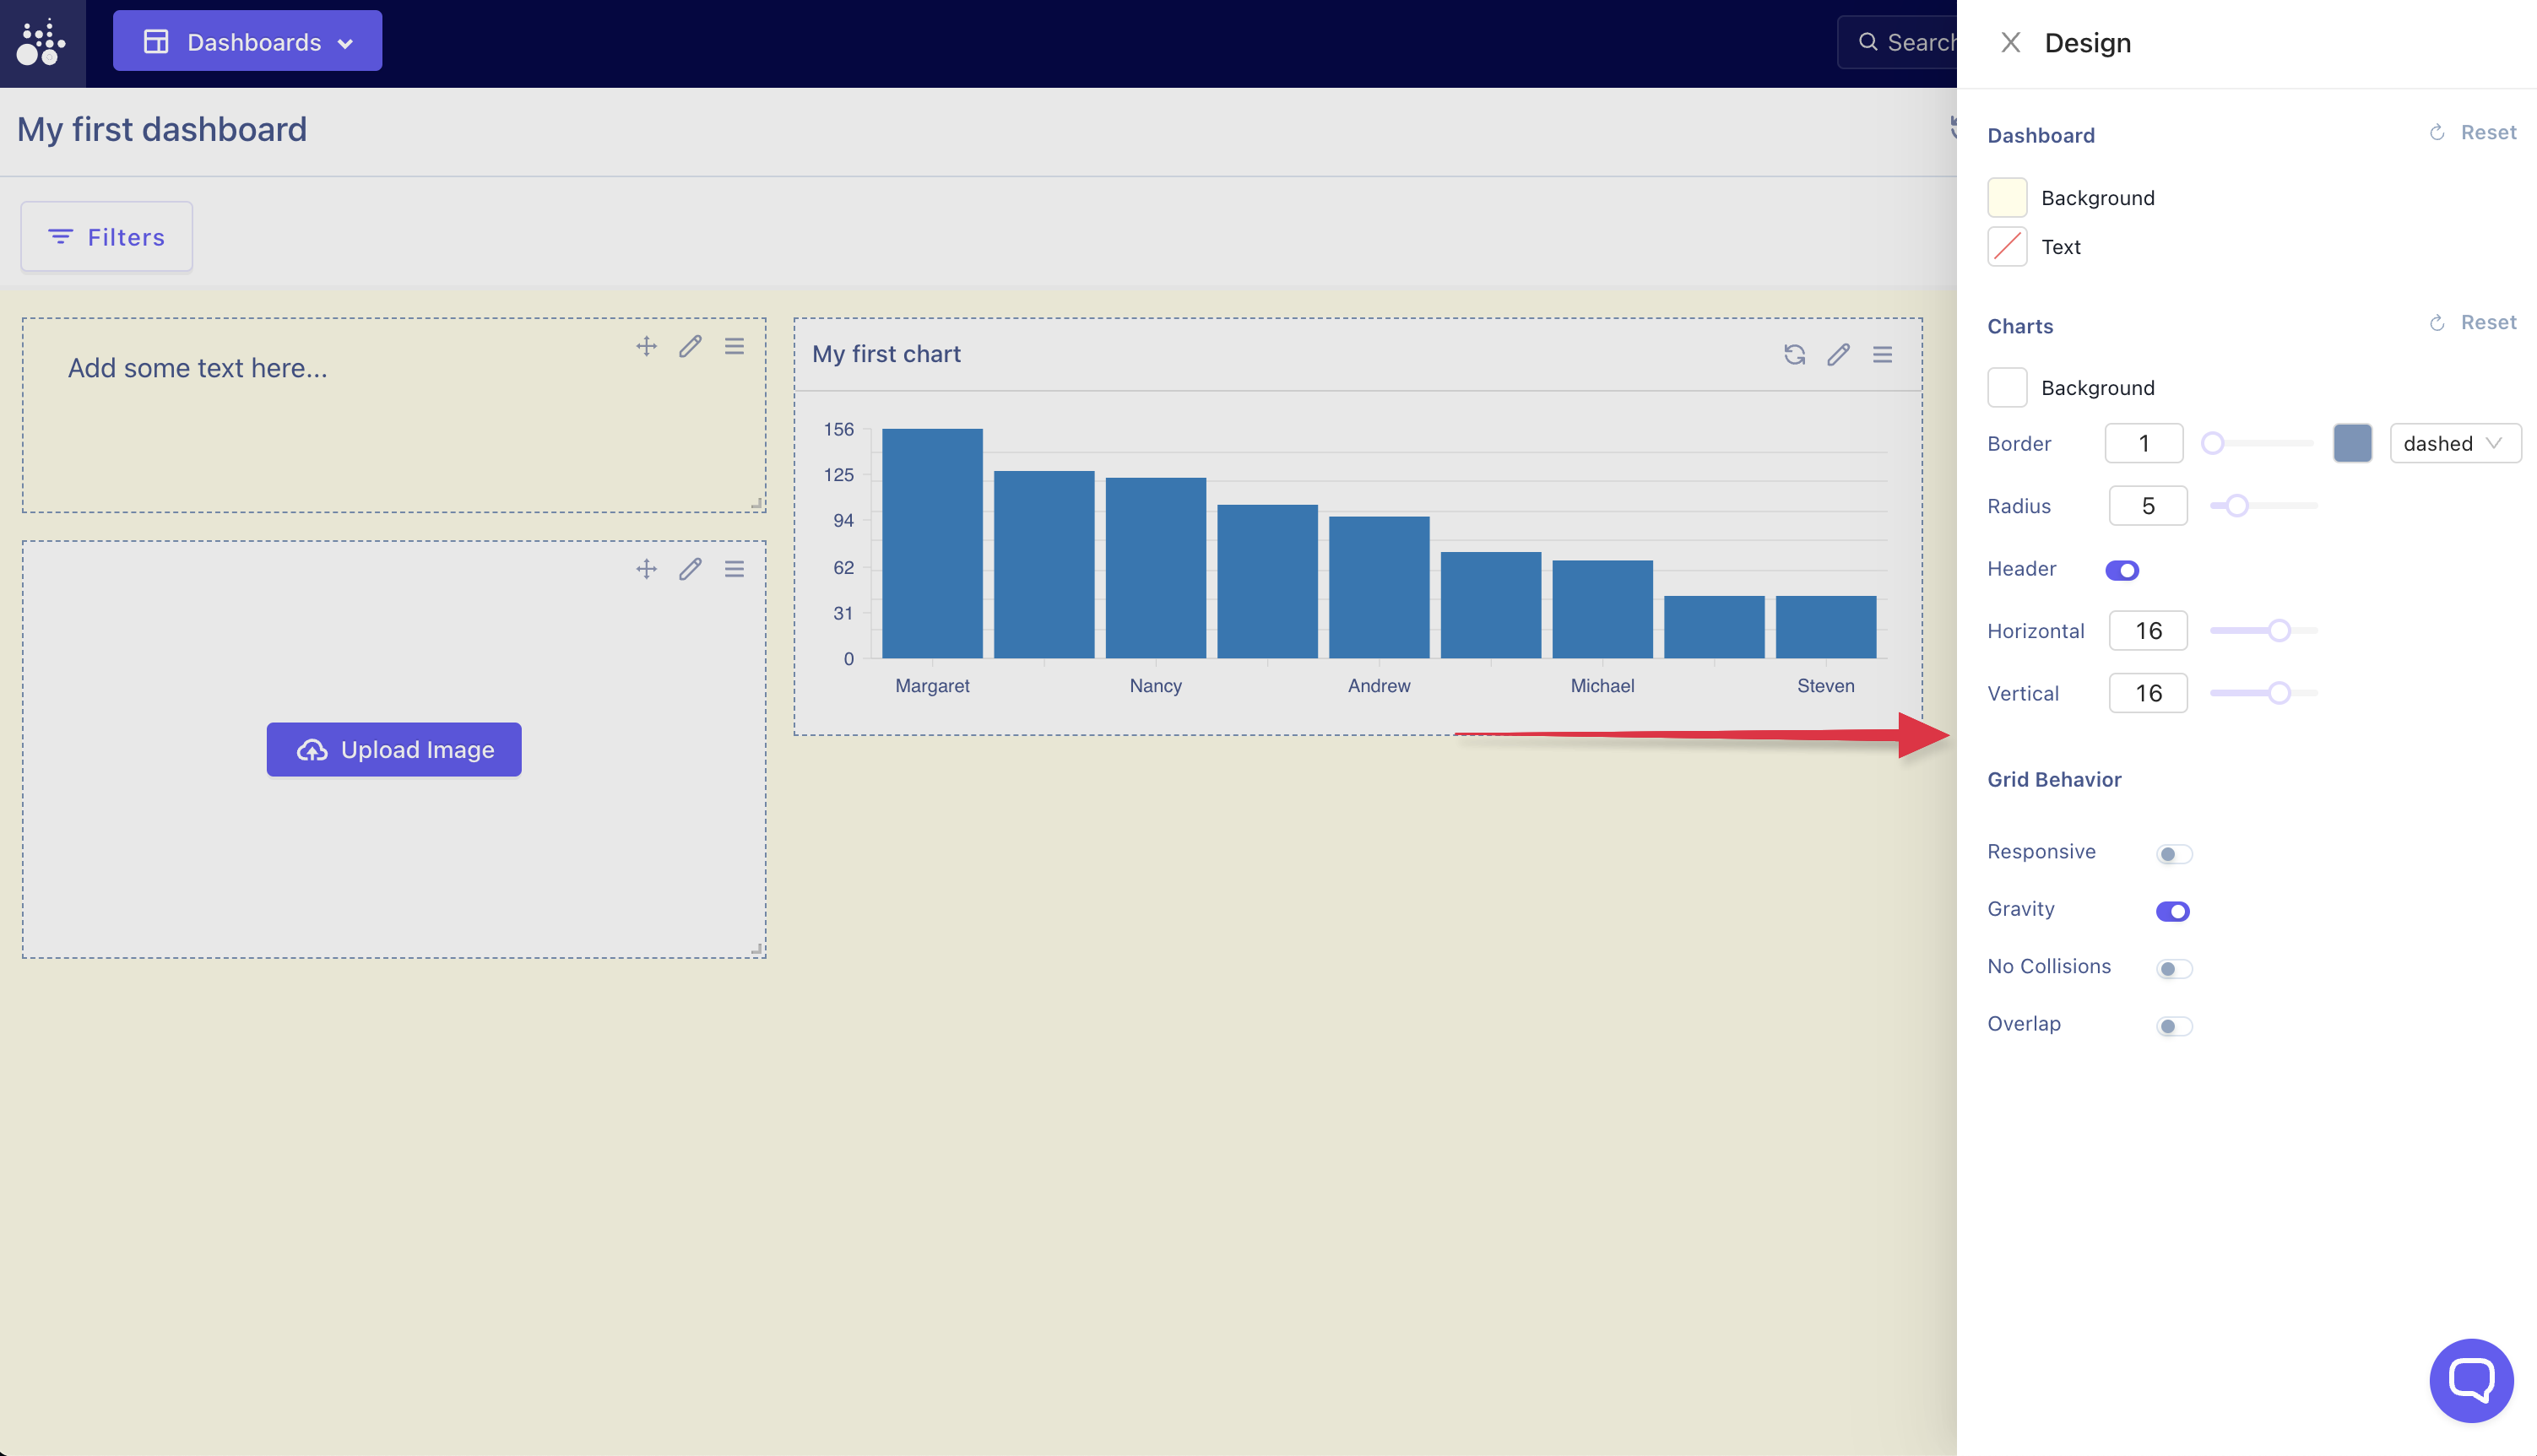
Change dashboard design
Opening the design panel reveals the visual settings for the dashboard and charts. If all the charts will have the same background color, or be transparent, it's easier to manage that here rather than in the individual chart settings. The individual chart settings will override the dashboard settings.
Dashboard menu
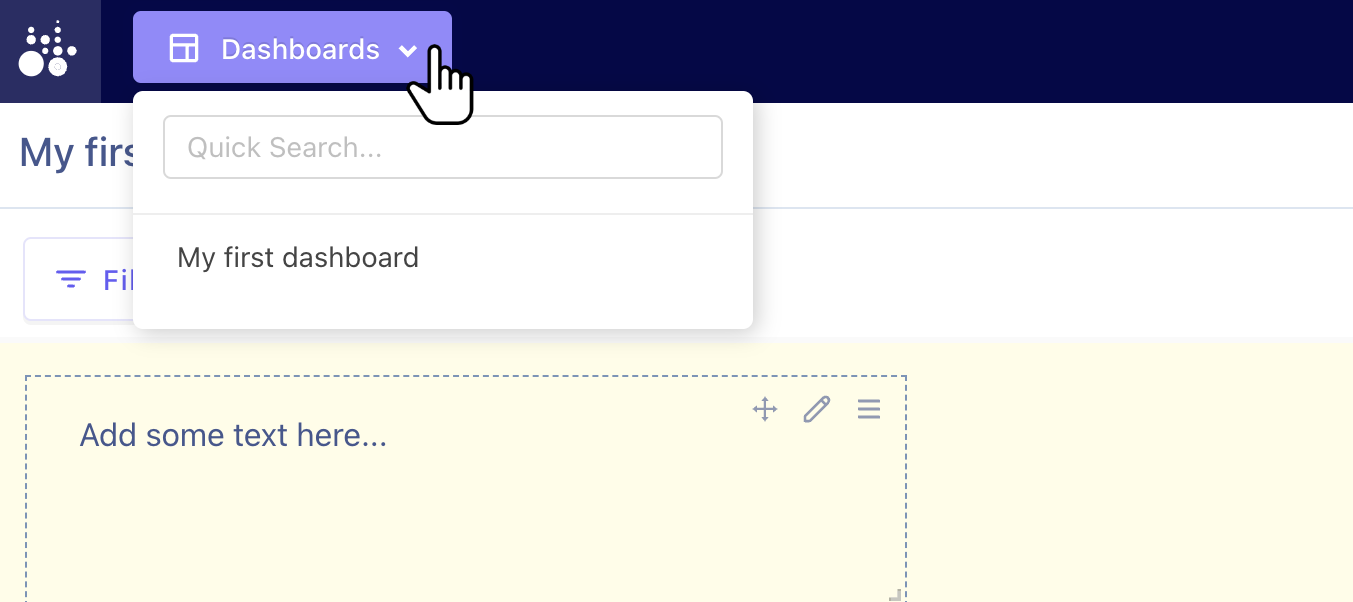
As dashboards are created they can be easily accessed from the Dashboard menu at the top of the page. Once this list gets longer simply type in the search field to refine your results or find the exact dashboard you are looking for.
